 WebFV
Install the Graphify Labs package
Use Graphify-Labs/graphify and the Python package graphifyy, with two final y characters. The executable is named graphify. The assistant instruction /graphify is a separate entry point; typing it into a normal shell is not how you start the CLI.
For a first check, map two small files you own before indexing a private repository. We tested Graphify 0.9.94 on macOS with Python 3.13, using a temporary virtual environment and the code-only workflow. It produced a graph, a report and an HTML visualization without configuring a model backend. Assistant registration and semantic extraction were not tested.
Check Python and isolate the installation
The official installation guide requires Python 3.10 or later and documents uv, pipx and virtual environments. Choose one installation method rather than adding the package to several Python environments at once.
For a disposable macOS or Linux shell test:
python3 --version
python3 -m venv .venv
.venv/bin/python -m pip install graphifyy==0.9.94
.venv/bin/graphify --version
The final command should identify Graphify and the installed version. On Windows, virtual-environment executables live under .venv\Scripts\; the official guide covers that path. We did not test Windows or Linux. Our macOS installation used binary wheels, so no source dependency build was needed.
If the command is missing, use the executable inside the environment you just created. A successful package installation in one Python environment does not put its command on every terminal's PATH.
Create a small input you can verify
Make a folder called sample containing these two original files. There is no need to run the application: the test is about identifying its structure.
pricing.py:
def total(quantity, unit_price):
    return round(quantity * unit_price, 2)
app.py:
from pricing import total


def invoice():
    return total(3, 12.5)
You can also download app.py and pricing.py. The expected relationship is easy to inspect directly: app.py imports total, and invoice calls it. These files contain no private repository content or credentials.
Extract, cluster and export
From the directory containing sample and .venv, run:
.venv/bin/graphify extract sample --code-only
.venv/bin/graphify cluster-only sample --no-label
cd sample
../.venv/bin/graphify export html
The local workflow documentation distinguishes structural code extraction from semantic processing. --code-only belongs to extract; it skips documents and media. --no-label keeps this clustering check from requesting model-generated community names.
In our run, extraction found two code files and wrote 4 nodes and 5 edges. Clustering produced one community, and HTML export succeeded from the sample directory. The output folder contained:
| File | What to check |
|---|---|
graphify-out/graph.json |
Node labels, relationships, source locations and Graphify version |
graphify-out/GRAPH_REPORT.md |
Counts and the relationships summarized by the tool |
graphify-out/graph.html |
A browser view of the same small graph |
The actual JSON export includes graphify_version: 0.9.94 and schema_version: 1. Both file nodes and both function nodes are present. An empty graph or missing functions would not pass this check merely because the command exited successfully.
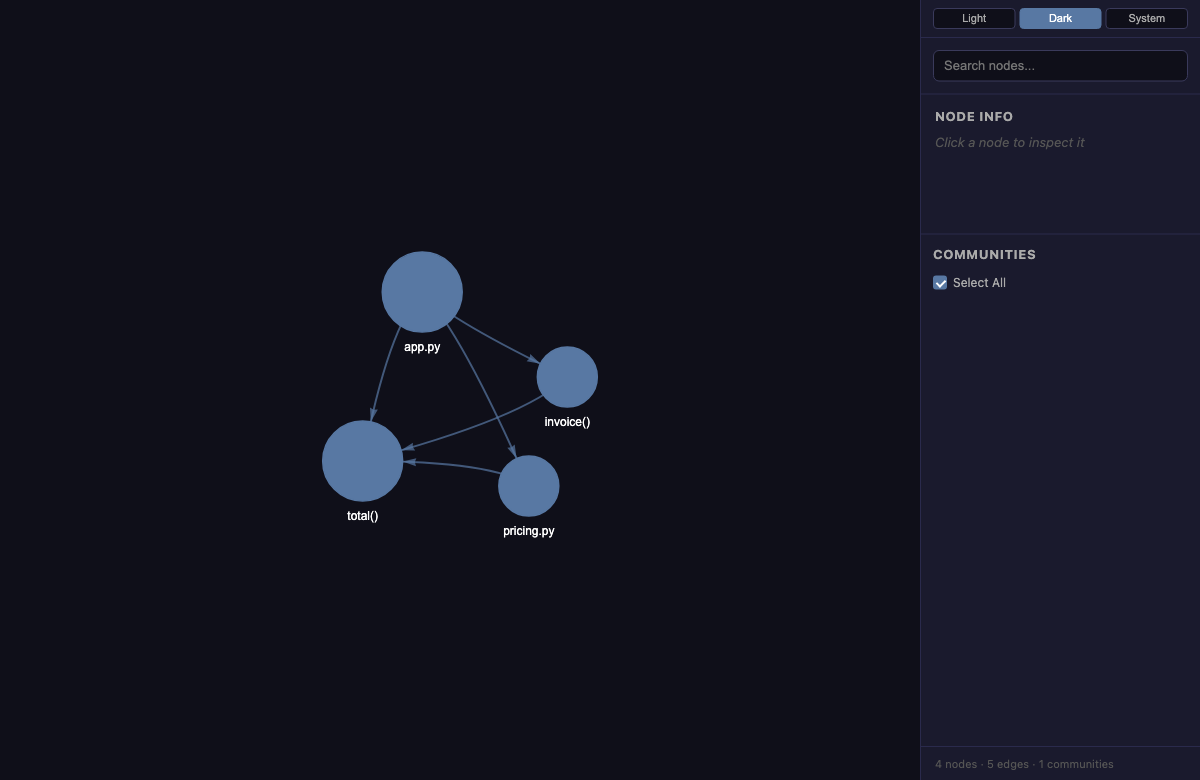
Open the full-size graph screenshot.
This is the generated HTML opened in a browser, not a diagram of an expected result. Its renderer referenced a CDN-hosted visualization library, so first-time HTML viewing can require network access or a cached copy. Local code parsing and offline availability of every visualization dependency are different questions.
Query the relationship you already know
Stay in sample and run:
../.venv/bin/graphify explain invoice
../.venv/bin/graphify path invoice total
The explanation located invoice() at app.py line 4. The path command returned one hop:
invoice() --calls [EXTRACTED]--> total()
The JSON also recorded the call at app.py line 5. This checks a known relationship across two files. It does not establish complete coverage of a large codebase, runtime behavior or correctness of the application's calculation.
The tiny report omitted a thin community and did not invent suggested questions. That is a useful limit of the sample: the graph contains little information to summarize. Inspect the JSON and known edges before trying to improve the appearance of the report.
Resolve the output-directory mistake
Our first graphify export html attempt ran one directory above sample and failed because it looked for graphify-out/graph.json there. The earlier extraction had written the graph inside sample instead. Changing into that directory fixed the export.
Check the path printed by extraction before rerunning it. A missing default graph path is not proof that parsing failed. Preserve the existing output while checking your working directory, and use the installed CLI's documented graph-path option if you need to work elsewhere.
Add the assistant workflow separately
The quickstart documents graphify install for registering an assistant integration. In a supported assistant, /graphify . requests a graph; Codex uses the Graphify skill selection. These are assistant instructions, not replacements for the shell commands tested above.
Documents and media can involve the assistant's model or a configured semantic backend. Review that path's data destination and usage terms before adding private material. The local code-only test does not validate a hosted service, model quality, account access or every assistant integration. For the difference between a skill package and an MCP connection, see the Claude Code plugin guide.